October 2018 Special Report Preview: Special report: Affordable rent numbers fall for first time in five years
Total affordable rent units see a 5% fall
The number of affordable rent (AR) lettings signed by housing providers for 2016/17 has dropped for the first time since the tenure was introduced five years ago.
Social Housing’s analysis of AR letting volumes and AR rent levels for the year to March 2017 shows that lettings decreased by five per cent to 44,645, from 47,173 in 2015/16.
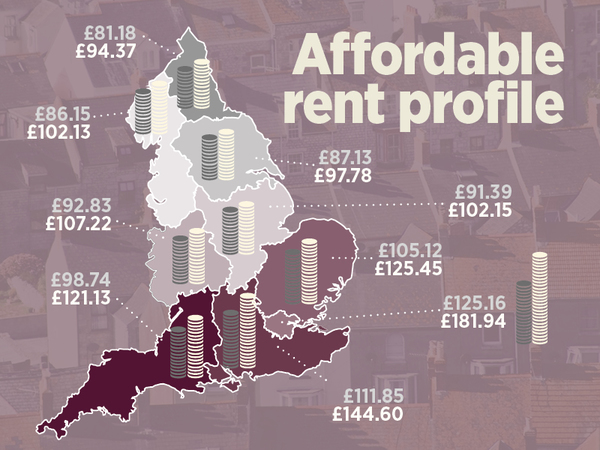
Average weekly AR rent levels in London (which has consistently had the highest regional average), meanwhile, hit £181.94 – £25.02 more per week than when Social Housing began its AR special reports in 2012/13.
AR enables providers to charge up to 80 per cent of market rents. Introduced by the 2010 coalition government, the idea behind the policy was that housing associations could use the additional income generated by the higher rent rates to offset the impact of lower government capital subsidy.
Subscribe to view the full report including interactive data tables and charts or click here to view the full article if you are already a subscriber
Summary of affordable rent lettings
| Affordable rent lettings | ||||||
|---|---|---|---|---|---|---|
| Affordable rent lettings | Change on year | Conversions to affordable rent | Other general needs lettings | Total general needs lettings made in year | Affordable rent as a % of total general needs lettings | |
| 2011/12 | 6,024 | n/a | 4,533 | 175,853 | 181,877 | 3% |
| 2012/13 | 29,793 | 395% | 23,877 | 148,581 | 178,374 | 17% |
| 2013/14 | 38,647 | 30% | 25,930 | 154,898 | 193,545 | 20% |
| 2014/15 | 45,668 | 18% | 21,306 | 151,736 | 197,404 | 23% |
| 2015/16 | 47,173 | 3% | 17,216 | 147,971 | 195,144 | 24% |
| 2016/17 | 44,645 | -5% | 12,754 | 122,344 | 166,989 | 27% |
Source: Regulator of Social Housing, Statistical Data Return 2017 to 2012
RELATED


